
 Company Profiles
 Company Culture
 Message
 Honor
Honor Video Center
 Company Reality
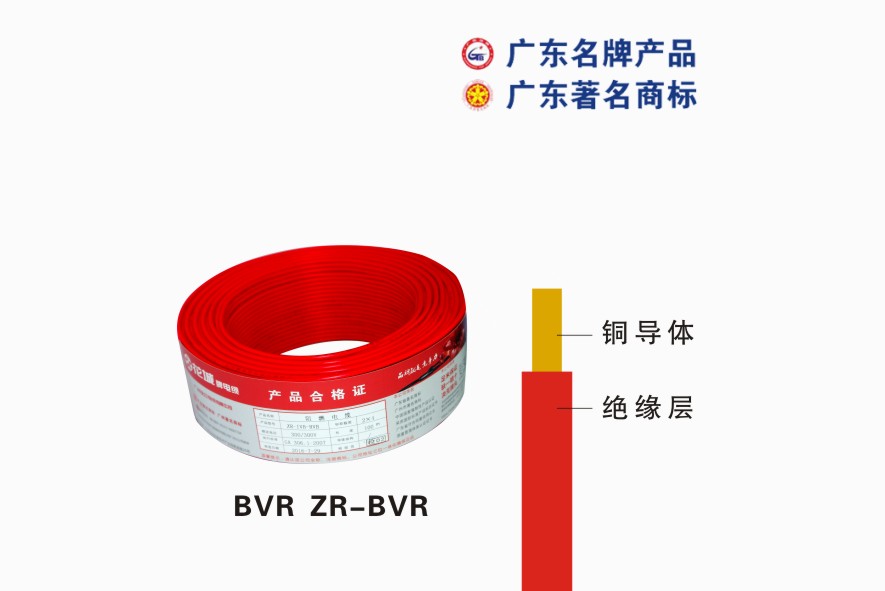 Pearl River Cable
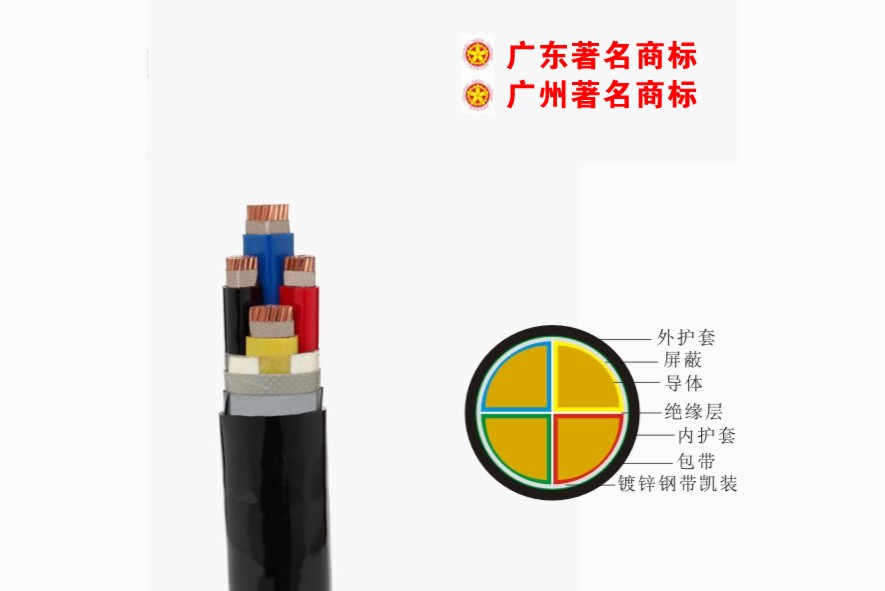 Low Voltage Cable
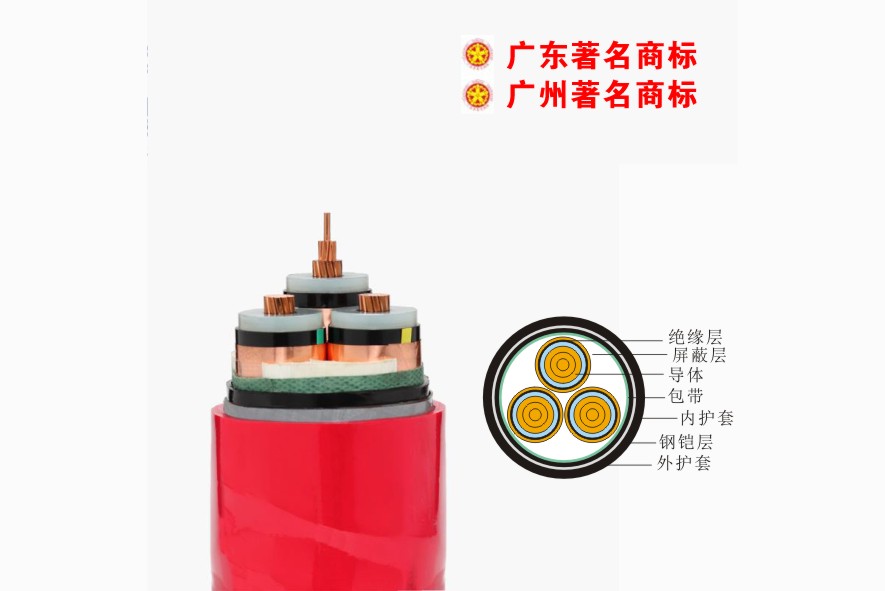 Medium Voltage
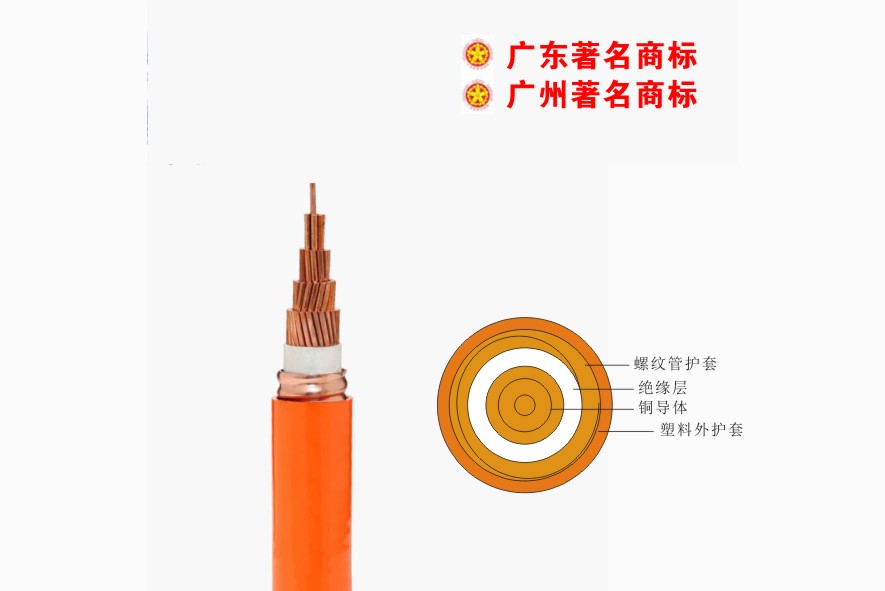 Mineral Cable
 Control Signal Cable
 Corporate News
 Cable Information
 Media Reports
 Network Reprint
Statistics of Pearl River Cable Imports in 2016
1. Macroeconomics
In China, China's economic data in July generally declined, and the weak economy has caused copper demand to make the market more worried. In early August, a number of important domestic economic data were announced, and the results were mostly unsatisfactory. As a major copper consumer, China is lacking in economic operations, and the market is increasingly worried about China's consumer demand.
In the United States, the Fed's interest rate hike has always attracted market attention. This month, the Fed has continuously released eagle signals. At the end of August, Yellen's hawkish speech has pushed the interest rate hike agenda to the highest focus of the market. The market has once again speculated on the Fed's interest rate hike expectations, and the US dollar has strengthened along the way. The August ADP data released by the United States on August 31 performed beautifully. The interest rate hike expectations are heating up again, but further expectations still need guidance from non-agricultural data.
In addition to the important economic data guidance of China and the United States, the performance of the crude oil market has more or less affected the trend of copper futures. The overall performance of oil prices in August peaked and corrected. Each OPEC oil producing country also has its own arrangements. The market is not optimistic about the expectations of reaching an agreement on freezing production at the OPEC meeting. Concerns about oversupply have intensified, and oil prices have fallen under pressure, recording six consecutive years, putting pressure on recent copper prices.
2. Market trend analysis this week
(1) Market analysis
Analysis of key products of cable raw materials (copper materials): According to monitoring data, the copper price fluctuated downward in August, and the overall market was slightly worse than that in July. The Yangtze River Nonferrous Spot Market was represented. The copper price was 37920 yuan/ton at the beginning of the month and the copper price at the end of the month was 36390 yuan / ton, down 1530 yuan, a decrease of 4.03%.
Macro aspect: This month, the negative correlation between copper prices and the US dollar has been broken again, and the overall US dollar has weakened and copper prices have also weakened. This situation has a lot to do with the recurrence of US economic data. Worries about the US economy far exceed the impact of the US dollar index. The copper market reflects more economic concerns. Of course, China's economic data slowed down during the period. Also played some influential roles. Looking ahead to September, the market will focus on two things. One is whether the Fed will raise interest rates. If it raises interest rates, it will be negative for copper prices, but if it does not raise interest rates, the concern is about the economy, which is not much profitable. The second is whether the traditional peak consumption season in September can play a supporting role. In the context of China's slowing economic growth, whether there is a bright spot in copper consumption is also worthy of attention.
On the market side: the copper price dropped from a high level during the month, the market mentality has changed significantly, and the trading situation is not very optimistic. Due to the relatively high processing fees of domestic copper concentrates, domestic smelters are enthusiastic and enthusiastic, and the refined copper market is very abundant. However, due to poor consumption in the domestic market, many refined copper are exported to foreign countries. Correspondingly, the domestic market Imported copper is very limited. Overall, the shipment sentiment of holders in August has been high, but market demand is very limited. In particular, manufacturers have maintained on-demand procurement and prefer good copper. On the part of traders, the sentiment of entering the market is relatively positive, and they are bullish on copper prices during the peak season. When the price of copper fluctuates in late August, there are often replenishment operations. With the advent of the peak consumption season in September, it is expected that copper prices may have a certain upside while maintaining a volatile market.
(2) Market outlook forecast
Recently, the lack of growth momentum and weak fundamentals of the global economy are still the biggest pressure on the copper market. From the current point of view, the most important thing is the Fed’s policy orientation. Whether to raise interest rates in September is still the focus of the market’s attention. From a fundamental point of view, September is the peak consumption season. Against the background of the slowdown in China’s economic growth, the peak season Performance is also a key factor in the copper market. As the traditional peak consumption season, the market has high expectations for the copper market in September. Coupled with the recent announcement of strong manufacturing PMI data in China, China’s economic worries have cooled, the copper market’s consumption prospects have improved, and the market’s confidence in the peak season has increased. Pay attention to the recent Chinese economic data. If there is any improvement, it will inject new impetus into the upward trend of copper prices.
3. Copper inventory
In terms of inventory: As of September 2, LME copper stocks were reported at 318,500 tons, a sharp increase of 42965 tons or 17% from last Friday, which was much higher than the average inventory of 196,000 tons during the year, which was the highest since October 2 last year At the same time, as of September 2, Shanghai copper stocks on the Shanghai Futures Exchange were reported at 152,404 tons, a decrease of 13,399 tons from last Friday, and were far below the average inventory value of 256,613 tons during the year, setting a low point since September 18 last year, showing that domestic Inventory pressure weakened relative to foreign countries. As of July of this year, the world's three major exchanges and bonded areas have reached 1.04 million tons of inventory, an increase of 106,000 tons from the 934,000 tons at the end of last year. Not only that, in August, the three major exchanges also began to increase inventory. Overall, the current excess of fundamentals in the copper market is the biggest pressure on copper prices.
4. Market dynamics
(1) Price dynamics of copper concentrate
Product name specification origin price (yuan/ton) fluctuated
Copper concentrate 20% Shandong 27800-28000-100
Copper concentrate 20% Inner Mongolia 28500-28700-100
Copper concentrate 20% Jiangsu 29100-29200-100
Copper concentrate 20% Hubei 28500-28700-100
Copper concentrate 20% Jiangxi 28900-29300-100
Copper concentrate 20% Yunnan 28900-29200-100
(2) Market dynamics of scrap copper prices
1. Jiangsu scrap copper price and market dynamics (August 31)
City content product name excluding tax price (yuan/ton)
Jiangsu 92-93% motor copper 29200-295000
Jiangsu-fire line 32800-330000
Jiangsu 1#1# bright copper wire 32300-325000
2. Tianjin Scrap Copper Price and Market Trends (August 31)
City content product name excluding tax price (yuan/ton)
Tianjin 94-95% No. 2 Copper 30200-305000
Tianjin 92-94% motor copper 29400-296000
Tianjin 1#1# bright copper wire 32300-325000
Tianjin 95-97% burning line 29900-302000
3. Shanghai scrap copper price and market dynamics (August 31)
Province content product name excluding tax price (yuan/ton)
Shanghai 92-94% motor copper 28900-293000
Shanghai H59 yellow miscellaneous copper 24600-248000
Shanghai 1#1# bright copper wire 32500-327000
4. Hebei scrap copper price and market dynamics (August 31)
City content product name excluding tax price (yuan/ton)
Hebei-fire line 30700-309000
Hebei 1#1# bright copper wire 32300-326000
Hebei-Brass Water Tank 22600-228000
5. Hunan scrap copper price and market dynamics (August 31)
City content product name excluding tax price (yuan/ton)
Hunan 92-93% No. 2 Copper 29000-293000
Hunan imported yellow miscellaneous copper 21300-215000
Hunan 1#1# bright copper wire 32300-325000
5. Industry hotspots
1. From January to June, China's net imports of refined copper increased by 20% year-on-year, which was a decrease from the previous month. In June, refined copper exports continued to maintain a certain volume; and imports also decreased slightly month-on-month, lowering the overall growth rate of net imports. From January to June, China’s cumulative copper concentrate imports increased by 34% year-on-year. In June, the year-on-year growth rate of copper concentrate imports decreased from the previous month. This was mainly due to the relatively high growth rate of copper concentrate imports in the previous month, while domestic smelting output The year-on-year growth rate was much lower. The copper concentrate inventory of smelters was relatively sufficient, and the import urgency was not high.
2. The cumulative year-on-year growth rate of copper concentrate imports from January to June is 34%, which is larger than the growth rate of the previous month, but the rate is not very large. The current copper concentrate processing fee is relatively high, and smelting enterprises have production willingness; and, due to internal and external reasons The narrowing of the price difference, coupled with the relaxation of policies, has increased the number of enterprises that have obtained the qualifications for processing and trading of imported copper concentrates, and the export of domestic smelted products has become more frequent, and domestic refined copper production is expected to maintain a growth momentum.
3. According to estimates, the total downstream demand for the seven major copper categories in June 2016 was around 860,000 tons; overall demand increased slightly year-on-year. The overall demand for electronic products in June increased slightly from the previous month, but continued to shrink year-on-year; the overall output of electronic products in 2016 was not very prosperous; it is difficult to see signs of improvement in the short term. The shipbuilding industry's copper demand in June improved significantly compared to the previous month, mainly due to seasonal factors; but it still maintained a contraction year-on-year; seasonal fluctuations are difficult to change the long-term downturn of the shipbuilding industry.
4. The report released by the World Bureau of Metal Statistics (WBMS) shows that the global copper market supply gap was 197,000 tons from January to June 2016, and there was a surplus of 372,000 tons in 2015. From January to June this year, the global copper mine output was 10 million tons, an increase of 5.9% over the same period last year. The global refined copper output increased to 11.6 million tons, an increase of 3.4% year-on-year. China's output increased significantly, with an increase of 250,000 tons, and Chile's output increased. 28,000 tons.
5. According to the financial reports of Bloomberg and listed companies of overseas mining companies, the newly added production capacity of overseas copper concentrates in 2016 was nearly 1.2 million tons, mainly due to the commissioning of a 300,000 tons and a 400,000 tons mine. The production capacity of the mine that was put into operation in 2015 will continue to release in 2016. In 2017, the new production capacity of copper concentrate is about 700,000 tons, which is a sharp decline compared with the growth rate of the million tons in the previous two years.
6. Jiangxi Copper (600362) announced that in the first half of the year, its revenue was 90.2 billion yuan, an increase of 19.4% year-on-year, but its net profit was only 470 million yuan, a decrease of 47.19% over the same period. Jiangxi Copper is the largest copper concentrate producer in China, with an annual output of more than 200,000 tons. After low-grade copper ore is screened and reaches a certain quality index, it is called copper concentrate and can be directly supplied to smelters to refine cathode copper and other products.
7. The world's largest copper miner-Chile's Codelco Copper Company increased its copper output in the first half of 2016 year-on-year, but recorded a financial loss. The company's CEO said that the company's current situation is "extremely fragile." The Chilean state-owned copper company reported on Friday that copper production in the first half of the year was 843,000 tons, an increase of 1.4% year-on-year, and it recorded a pre-tax loss of US$97 million.

.png")
